American Promise – Citizen Data 2023 National Poll
Question 1: A proposed constitutional amendment would allow Congress and the states to reasonably regulate and limit money in our campaigns and elections. Would you support or oppose this amendment?
Gender
Total | Male | Female | Prefer to self-describe | |
Strongly support | 40.0% | 46.7% | 33.6% | 81.0% |
Somewhat support | 36.6% | 34.3% | 38.8% | 19.0% |
Somewhat oppose | 5.7% | 5.5% | 5.9% | 0.0% |
Strongly oppose | 3.8% | 5.2% | 2.7% | 0.0% |
Not sure | 13.9% | 8.4% | 19.0% | 0.0% |
Age
Total | 18-34 | 35-54 | 55-64 | 65+ | |
Strongly support | 40.0% | 32.6% | 36.5% | 38.6% | 51.3% |
Somewhat support | 36.6% | 35.2% | 38.8% | 40.8% | 32.6% |
Somewhat oppose | 5.7% | 12.1% | 5.3% | 1.8% | 3.1% |
Strongly oppose | 3.8% | 4.2% | 3.3% | 3.7% | 4.2% |
Not sure | 13.9% | 15.9% | 16.2% | 15.2% | 8.8% |
Race
Total | Asian | Black or African American | Hispanic, Latina or Latino | Other | White | |
Strongly support | 40.0% | 37.3% | 30.1% | 31.9% | 41.7% | 43.3% |
Somewhat support | 36.6% | 33.8% | 37.2% | 35.3% | 41.5% | 36.7% |
Somewhat oppose | 5.7% | 17.6% | 9.9% | 10.0% | 6.9% | 3.4% |
Strongly oppose | 3.8% | 0.0% | 9.7% | 2.8% | 0.0% | 3.4% |
Not sure | 13.9% | 11.4% | 13.1% | 20.0% | 9.8% | 13.2% |
Education
Total | Bachelors Degree | Graduate Degree |
Less than Bachelors Degree
|
|
Strongly support | 40.0% | 42.4% | 56.7% | 34.7% |
Somewhat support | 36.6% | 39.1% | 25.2% | 38.4% |
Somewhat oppose | 5.7% | 5.5% | 6.8% | 5.5% |
Strongly oppose | 3.8% | 2.0% | 5.4% | 4.2% |
Not sure | 13.9% | 11.0% | 5.9% | 17.2% |
Party ID
Total | A party other than Democrat or Republican | Democrats/Leaners | Non-partisan or Independent | Republican/Leaners | |
Strongly support | 40.0% | 53.9% | 44.4% | 43.7% | 32.0% |
Somewhat support | 36.6% | 27.6% | 33.9% | 34.4% | 41.4% |
Somewhat oppose | 5.7% | 2.9% | 5.2% | 4.7% | 6.9% |
Strongly oppose | 3.8% | 6.5% | 2.7% | 6.2% | 3.5% |
Not sure | 13.9% | 9.1% | 13.8% | 11.0% | 16.1% |
Ideology
Total | Very conservative | Somewhat conservative | Moderate | Somewhat liberal | Very liberal | Not sure | |
Strongly support | 40.0% | 35.9% | 33.3% | 40.8% | 48.5% | 44.5% | 25.2% |
Somewhat support | 36.6% | 27.5% | 41.0% | 41.0% | 35.7% | 29.3% | 20.9% |
Somewhat oppose | 5.7% | 5.7% | 8.8% | 4.8% | 4.3% | 5.3% | 0.0% |
Strongly oppose | 3.8% | 7.1% | 4.9% | 3.1% | 1.0% | 3.7% | 5.0% |
Not sure | 13.9% | 23.8% | 12.1% | 10.3% | 10.4% | 17.1% | 48.9% |
Religion
Total | Protestant (specific denomination) | Protestant (no specific denomination) | Roman Catholic | Mormon | Orthodox Christian | Jewish | Muslim | Hindu | |
Strongly support | 40.0% | 34.7% | 34.7% | 43.6% | 55.1% | 85.3% | 41.2% | 47.8% | 44.9% |
Somewhat support | 36.6% | 37.9% | 44.8% | 37.0% | 25.7% | 14.7% | 49.7% | 28.0% | 12.4% |
Somewhat oppose | 5.7% | 3.9% | 4.1% | 7.5% | 0.0% | 0.0% | 0.0% | 13.3% | 31.7% |
Strongly oppose | 3.8% | 4.9% | 2.2% | 1.9% | 0.0% | 0.0% | 2.6% | 11.0% | 11.0% |
Not sure | 13.9% | 18.5% | 14.3% | 10.0% | 19.2% | 0.0% | 6.5% | 0.0% | 0.0% |
Buddhist | Sikh | Folk religions | Atheist | Agnostic | Nothing in particular | Something else | Not sure |
29.7% | 0.0% | 25.1% | 58.6% | 47.7% | 39.7% | 36.6% | 34.4% |
37.7% | 0.0% | 48.6% | 29.5% | 31.8% | 33.3% | 34.6% | 42.0% |
0.0% | 0.0% | 0.0% | 3.0% | 13.5% | 7.6% | 3.0% | 0.0% |
0.0% | 0.0% | 0.0% | 1.9% | 0.0% | 3.9% | 11.5% | 0.0% |
32.6% | 0.0% | 26.3% | 7.0% | 7.1% | 15.5% | 14.4% | 23.6% |
Question 2: Do you agree or disagree with the following statement: “Individuals and entities should be able to spend unlimited amounts of money to influence our campaigns and elections?”
Gender
Total | Male | Female | Prefer to self-describe | |
Strongly agree | 8.0% | 12.3% | 4.2% | 0.0% |
Somewhat agree | 10.8% | 10.5% | 11.2% | 0.0% |
Somewhat disagree | 22.0% | 20.1% | 23.8% | 0.0% |
Strongly disagree | 52.4% | 52.2% | 52.3% | 100.0% |
Not sure | 6.8% | 4.9% | 8.5% | 0.0% |
Age
Total | 18-34 | 35-54 | 55-64 | 65+ | |
Strongly agree | 8.0% | 12.1% | 9.5% | 6.6% | 3.6% |
Somewhat agree | 10.8% | 15.8% | 16.3% | 5.0% | 3.7% |
Somewhat disagree | 22.0% | 20.3% | 20.4% | 28.1% | 21.4% |
Strongly disagree | 52.4% | 43.3% | 45.6% | 53.1% | 68.0% |
Not sure | 6.8% | 8.5% | 8.2% | 7.2% | 3.4% |
Race
Total | Asian | Black or African American | Hispanic, Latina or Latino | Other | White | |
Strongly agree | 8.0% | 11.1% | 12.9% | 13.0% | 3.2% | 6.2% |
Somewhat agree | 10.8% | 20.0% | 22.0% | 11.3% | 14.8% | 8.1% |
Somewhat disagree | 22.0% | 22.9% | 20.0% | 22.6% | 26.4% | 22.0% |
Strongly disagree | 52.4% | 36.8% | 37.6% | 44.6% | 50.8% | 57.5% |
Not sure | 6.8% | 9.2% | 7.5% | 8.5% | 4.9% | 6.3% |
Education
Total | Bachelors Degree | Graduate Degree |
Less than Bachelors Degree
|
|
Strongly agree | 8.0% | 4.5% | 16.4% | 7.3% |
Somewhat agree | 10.8% | 8.1% | 8.2% | 12.6% |
Somewhat disagree | 22.0% | 26.8% | 16.6% | 21.3% |
Strongly disagree | 52.4% | 55.5% | 56.1% | 50.2% |
Not sure | 6.8% | 5.1% | 2.7% | 8.5% |
Party ID
Total | A party other than Democrat or Republican | Democrats/Leaners | Non-partisan or Independent | Republican/Leaners | |
Strongly agree | 8.0% | 19.7% | 9.4% | 6.5% | 6.6% |
Somewhat agree | 10.8% | 3.3% | 11.7% | 9.5% | 11.0% |
Somewhat disagree | 22.0% | 17.8% | 20.0% | 18.5% | 26.5% |
Strongly disagree | 52.4% | 59.2% | 53.1% | 61.1% | 46.2% |
Not sure | 6.8% | 0.0% | 5.8% | 4.3% | 9.7% |
Ideology
Total | Very conservative | Somewhat conservative | Moderate | Somewhat liberal | Very liberal | Not sure | |
Strongly agree | 8.0% | 13.2% | 6.9% | 6.0% | 6.8% | 11.6% | 5.0% |
Somewhat agree | 10.8% | 9.7% | 9.6% | 13.8% | 2.8% | 15.2% | 0.0% |
Somewhat disagree | 22.0% | 18.0% | 30.8% | 21.6% | 21.3% | 12.2% | 37.9% |
Strongly disagree | 52.4% | 48.3% | 43.2% | 54.3% | 64.1% | 53.5% | 48.1% |
Not sure | 6.8% | 10.9% | 9.5% | 4.2% | 4.9% | 7.4% | 9.1% |
Religion
Total | Protestant (specific denomination) | Protestant (no specific denomination) | Roman Catholic | Mormon | Orthodox Christian | Jewish | Muslim | Hindu | |
Strongly support | 8.0% | 7.5% | 6.6% | 7.9% | 0.0% | 13.6% | 15.0% | 45.6% | 35.4% |
Somewhat support | 10.8% | 10.5% | 13.3% | 11.4% | 6.7% | 15.0% | 5.4% | 0.0% | 12.4% |
Somewhat oppose | 22.0% | 22.5% | 25.7% | 25.5% | 25.7% | 0.0% | 28.7% | 28.0% | 18.8% |
Strongly oppose | 52.4% | 50.7% | 47.5% | 49.6% | 67.6% | 71.3% | 50.8% | 26.4% | 33.5% |
Not sure | 6.8% | 8.8% | 7.0% | 5.6% | 0.0% | 0.0% | 0.0% | 0.0% | 0.0% |
Buddhist | Sikh | Folk religions | Atheist | Agnostic | Nothing in particular | Something else | Not sure |
0.0% | 0.0% | 0.0% | 3.6% | 1.3% | 6.8% | 15.8% | 0.0% |
20.9% | 0.0% | 48.6% | 6.5% | 5.4% | 11.8% | 11.0% | 10.0% |
26.4% | 0.0% | 25.1% | 13.3% | 19.8% | 17.5% | 18.5% | 17.2% |
52.8% | 0.0% | 26.3% | 66.2% | 67.9% | 57.6% | 47.0% | 58.0% |
0.0% | 0.0% | 0.0% | 10.3% | 5.6% | 6.3% | 7.7% | 14.8% |
Question 3: Do you agree or disagree with the following statement: “The influence of money in politics is a threat to our democracy.”
Gender
Total | Male | Female | Prefer to self-describe | |
Strongly agree | 56.2% | 60.2% | 52.3% | 100.0% |
Somewhat agree | 33.3% | 29.5% | 37.0% | 0.0% |
Somewhat disagree | 4.4% | 5.3% | 3.7% | 0.0% |
Strongly disagree | 2.0% | 2.0% | 2.0% | 0.0% |
Not sure | 4.1% | 3.0% | 5.1% | 0.0% |
Age
Total | 18-34 | 35-54 | 55-64 | 65+ | |
Strongly agree | 56.2% | 48.4% | 54.7% | 58.1% | 63.4% |
Somewhat agree | 33.3% | 40.1% | 31.2% | 34.5% | 29.0% |
Somewhat disagree | 4.4% | 7.7% | 5.5% | 1.2% | 2.4% |
Strongly disagree | 2.0% | 1.7% | 3.1% | 1.7% | 1.1% |
Not sure | 4.1% | 2.0% | 5.4% | 4.5% | 4.2% |
Race
Total | Asian | Black or African American | Hispanic, Latina or Latino | Other | White | |
Strongly agree | 56.2% | 41.6% | 43.8% | 58.8% | 51.9% | 58.7% |
Somewhat agree | 33.3% | 37.0% | 32.8% | 31.5% | 28.3% | 33.7% |
Somewhat disagree | 4.4% | 8.6% | 12.0% | 2.9% | 6.3% | 3.2% |
Strongly disagree | 2.0% | 10.2% | 2.7% | 1.4% | 3.8% | 1.5% |
Not sure | 4.1% | 2.5% | 8.8% | 5.4% | 9.6% | 2.9% |
Education
Total | Bachelors Degree | Graduate Degree |
Less than Bachelors Degree
|
||
Strongly agree | 56.2% | 57.9% | 58.5% | 54.8% | Strongly support |
Somewhat agree | 33.3% | 34.8% | 33.4% | 32.6% | Somewhat support |
Somewhat disagree | 4.4% | 4.4% | 3.2% | 4.8% | Somewhat oppose |
Strongly disagree | 2.0% | 0.7% | 2.1% | 2.5% | Strongly oppose |
Not sure | 4.1% | 2.2% | 2.8% | 5.3% | Not sure |
Party ID
Total | A party other than Democrat or Republican | Democrats/Leaners | Non-partisan or Independent | Republican/Leaners | |
Strongly agree | 56.2% | 55.3% | 58.2% | 59.7% | 51.9% |
Somewhat agree | 33.3% | 34.3% | 32.4% | 32.7% | 34.5% |
Somewhat disagree | 4.4% | 7.1% | 3.7% | 3.3% | 5.7% |
Strongly disagree | 2.0% | 3.3% | 2.1% | 1.8% | 2.0% |
Not sure | 4.1% | 0.0% | 3.7% | 2.5% | 5.9% |
Ideology
Total | Very conservative | Somewhat conservative | Moderate | Somewhat liberal | Very liberal | Not sure | |
Strongly agree | 56.2% | 56.2% | 52.2% | 52.5% | 67.4% | 61.0% | 51.0% |
Somewhat agree | 33.3% | 29.2% | 34.8% | 38.4% | 29.3% | 25.4% | 29.2% |
Somewhat disagree | 4.4% | 4.1% | 5.2% | 3.2% | 1.5% | 10.5% | 0.0% |
Strongly disagree | 2.0% | 3.9% | 2.6% | 2.4% | 0.0% | 0.0% | 5.0% |
Not sure | 4.1% | 6.6% | 5.1% | 3.5% | 1.8% | 3.1% | 14.8% |
Religion
Total | Protestant (specific denomination) | Protestant (no specific denomination) | Roman Catholic | Mormon | Orthodox Christian | Jewish | Muslim | Hindu | |
Strongly support | 56.2% | 48.3% | 55.7% | 53.9% | 73.4% | 69.2% | 47.3% | 47.8% | 55.9% |
Somewhat support | 33.3% | 38.2% | 37.1% | 35.4% | 26.6% | 30.8% | 49.6% | 28.0% | 44.1% |
Somewhat oppose | 4.4% | 6.2% | 0.8% | 4.5% | 0.0% | 0.0% | 0.0% | 24.2% | 0.0% |
Strongly oppose | 2.0% | 1.9% | 1.7% | 2.0% | 0.0% | 0.0% | 0.0% | 0.0% | 0.0% |
Not sure | 4.1% | 5.4% | 4.7% | 4.1% | 0.0% | 0.0% | 3.1% | 0.0% | 0.0% |
Buddhist | Sikh | Folk religions | Atheist | Agnostic | Nothing in particular | Something else | Not sure |
59.6% | 0.0% | 25.1% | 71.9% | 76.1% | 62.8% | 57.0% | 67.6% |
27.3% | 0.0% | 74.9% | 14.7% | 22.5% | 26.0% | 31.8% | 17.6% |
13.1% | 0.0% | 0.0% | 1.8% | 1.3% | 6.3% | 2.4% | 0.0% |
0.0% | 0.0% | 0.0% | 8.0% | 0.0% | 1.4% | 4.3% | 0.0% |
0.0% | 0.0% | 0.0% | 3.5% | 0.0% | 3.4% | 4.5% | 14.8% |
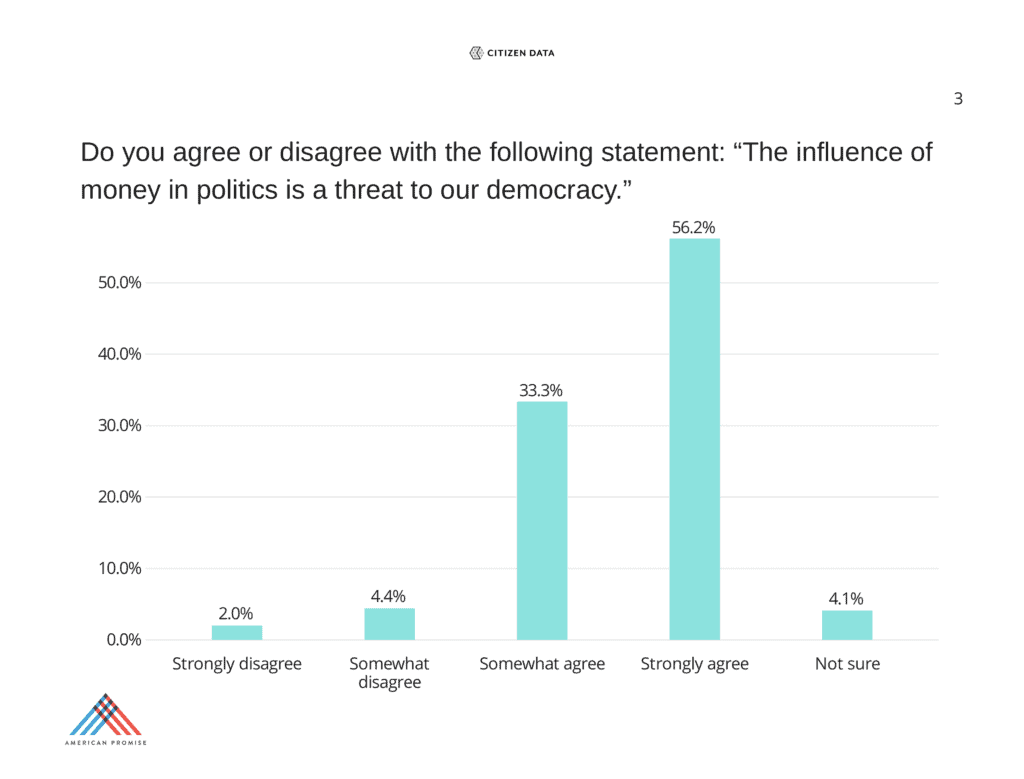
Citizen Data sampled N = 1,003 registered voters during July, 2023 as a part of its monthly omnibus survey. The margin of error is +/- 3.1%. Results are weighted on age, race, and party ID.